Environmental Strategy
Attenborough Arts Centre functions within and as a part of the University of Leicester. We recognise that the activities we do inevitably impact on the environment and that we have a responsibility to environmental protection.
We continue to work with the University of Leicester and other partners to reduce our carbon footprint and improve our environmental sustainability. The University is committed to influencing positive change in the world through research and research inspired education. Environmental Sustainability is one of the Universities 4 guiding principles used to inform decision making. It seeks to achieve continual improvement to how it understands and responds to its environmental impact. This is achieved through Environmental Management Systems and Education.
With the University we have committed to contributing to the UN Sustainable Development Goals (SDGs) as one of the first UK higher education signatories of the SDG Accord in September 2017. To learn more, visit their webpage.
To learn more about our full Environmental Strategy , download our Environmental Plan V4 2022-25 (577KB).

Julie’s Bicycle 2024-25 Results
As an Arts Council England NPO we report yearly about our energy usage to be accountable for our impact while understanding how we can make crucial changes. In order to be transparent and honest, below are results from our latest data input for 2024-25.
Total Carbon Footprint: 2024-25
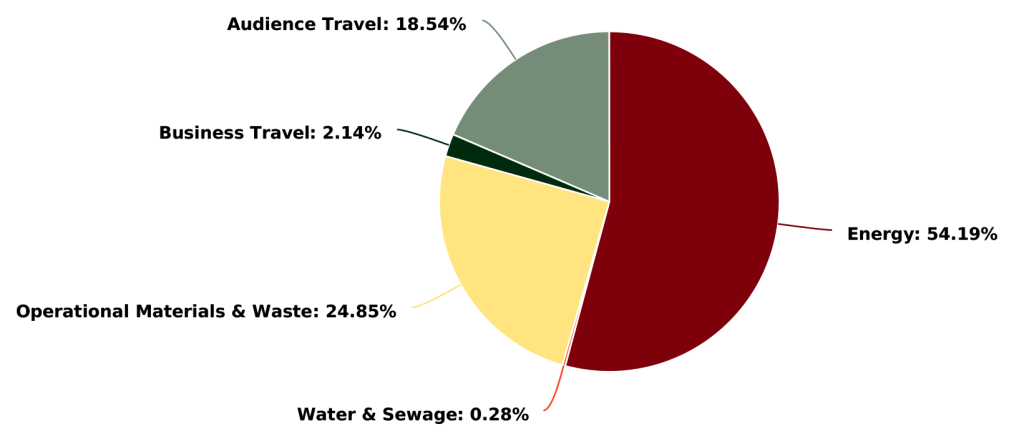
| Impact | Consumption | Carbon |
|---|---|---|
| Energy | 50.07 tonnes CO2e | |
| Water & Sewage | 1,502 m3 | 255kg CO2e |
| Operational Materials & Waste | 7 tonnes | 22.96 tonnes CO2e |
| Business Travel | 9,756 km | 1.98 tonnes CO2e |
| Audience Travel | - | 17.13 tonnes CO2e |
| Emissions Total | - | 92.39 tonnes CO2e |
Emissions: 2024-25
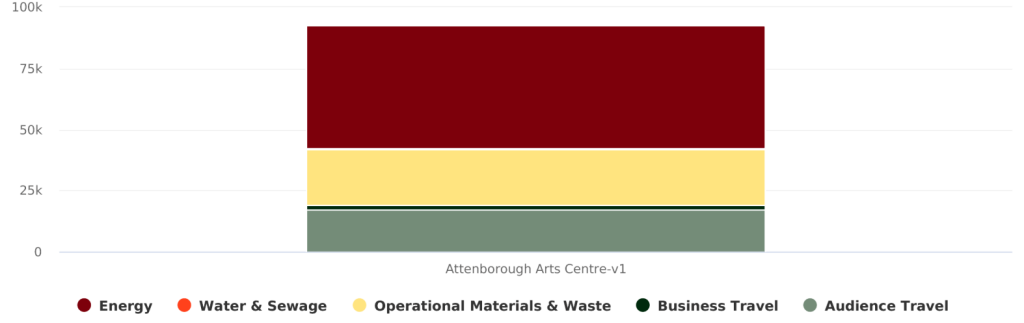
| Energy | Water & Sewage | Operational Materials & Waste | Business Travel | Audience Travel | Fleet Travel | Total |
|---|---|---|---|---|---|---|
| 50.07 tonnes CO2e | 255kg CO2e | 22.96 CO2e | 1.98 tonnes CO2e | 17.13 tonnes CO2e | 0 kg CO2e | 92.39 tonnes CO2e |